Say "PI" Again.
The second in the series… Daring to explore the role of the Performance Indicator (PI) in operational planning.
Chapter One: Hindsight
Previously,
- We saw three metrics from The Green Grid - defining different aspects of data center cooling performance - come together to create the Performance Indicator.
- We discovered Hawaiian investment banks should not aim for the same performance targets as Facebook. Rather, they should focus on reflecting their own business needs, facility type, and external environment.
- We outlined how the metrics can be calculated using measurement and/or engineering simulation, and displayed with the wonder that is the PI tool.
Chapter Two: Foresight
Being confident of the potential future cooling performance of a data center is invaluable in decision-making for operational planning.
Through three short examples, we will take a closer look at how Computational Fluid Dynamics (CFD) and PI can be used to compare the relative performance of some operational plans – fixes, improvement measures, and an IT deployment – vitally, before they are executed in reality.
Introducing..
In true Tarantino fashion, let’s start at the end: the fixes work, efficiency is improved, but when new IT is added to take the room to its full capacity, it tragically fails.
Now, we cut to the present day, and the data center manager has been reading about PI. She has assigned performance targets for the partially loaded facility, with an emphasis on achieving high energy efficiency while maintaining IT thermal conformance and resilience.
She has built an accurate Virtual Facility, and intends to review her operational plans before implementing them. The simulation results are now ready to analyze.
Chapter Three: Pop the Hood
When faced with a glass-doored rack, the inlet temperature of the IT inside could be anything from acceptable to outright hot! Although it may seem like an outdated operational challenge, this is still something seen all too often in modern well-operating facilities.
So, the team either needs to open that door and install some temperature sensors, or look at the CFD model.
With the Virtual Facility, the data center manager diagnoses issues, and subsequently fixes them, as demonstrated below.
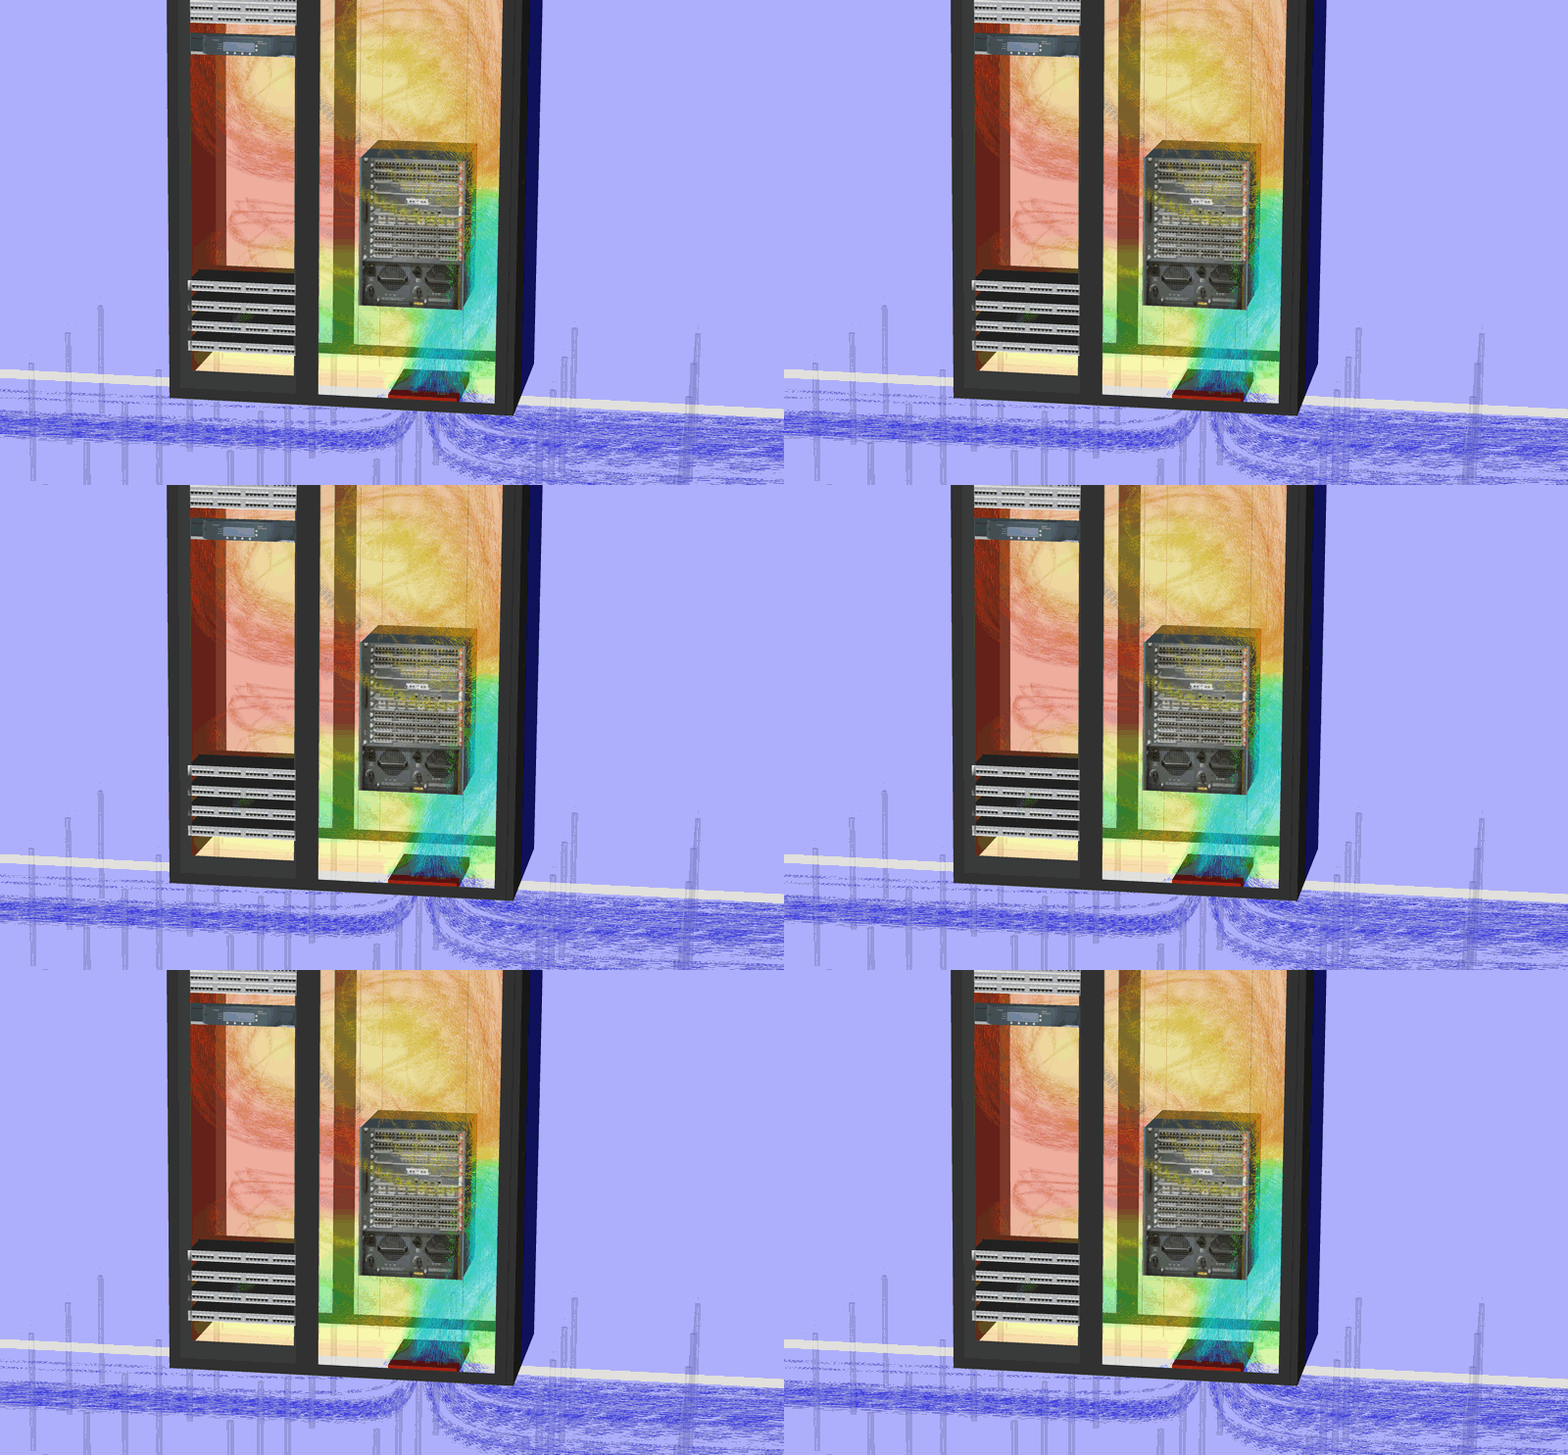
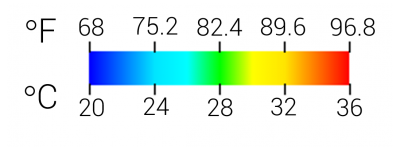
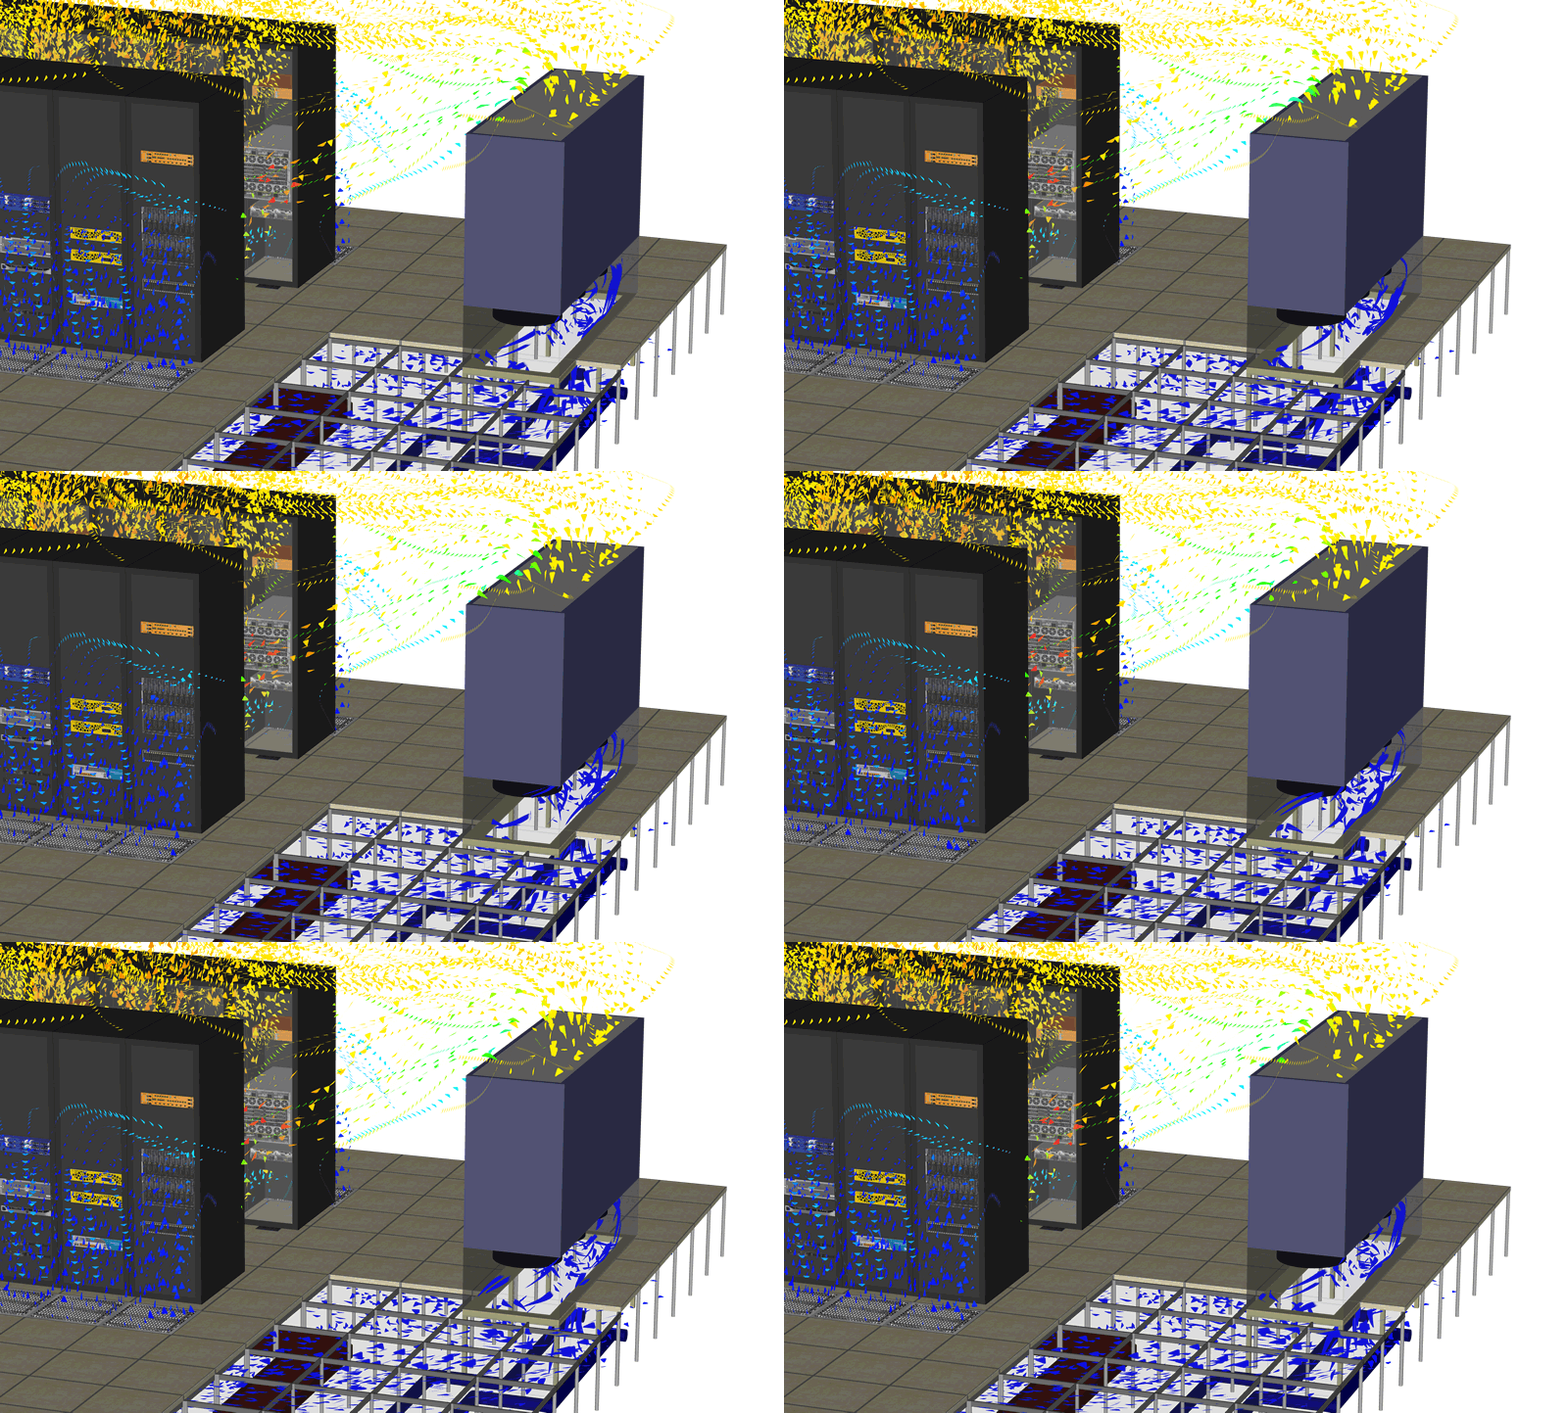
The simulation shows how this inflow pulls what little air it can from the floor void through the foam cable penetration, and the rest from its own exhaust – so it fails to operate at suitable temperatures.
Blocked Cable Penetration
Going against common practice, we realize the blocking of floor holes is not always beneficial.
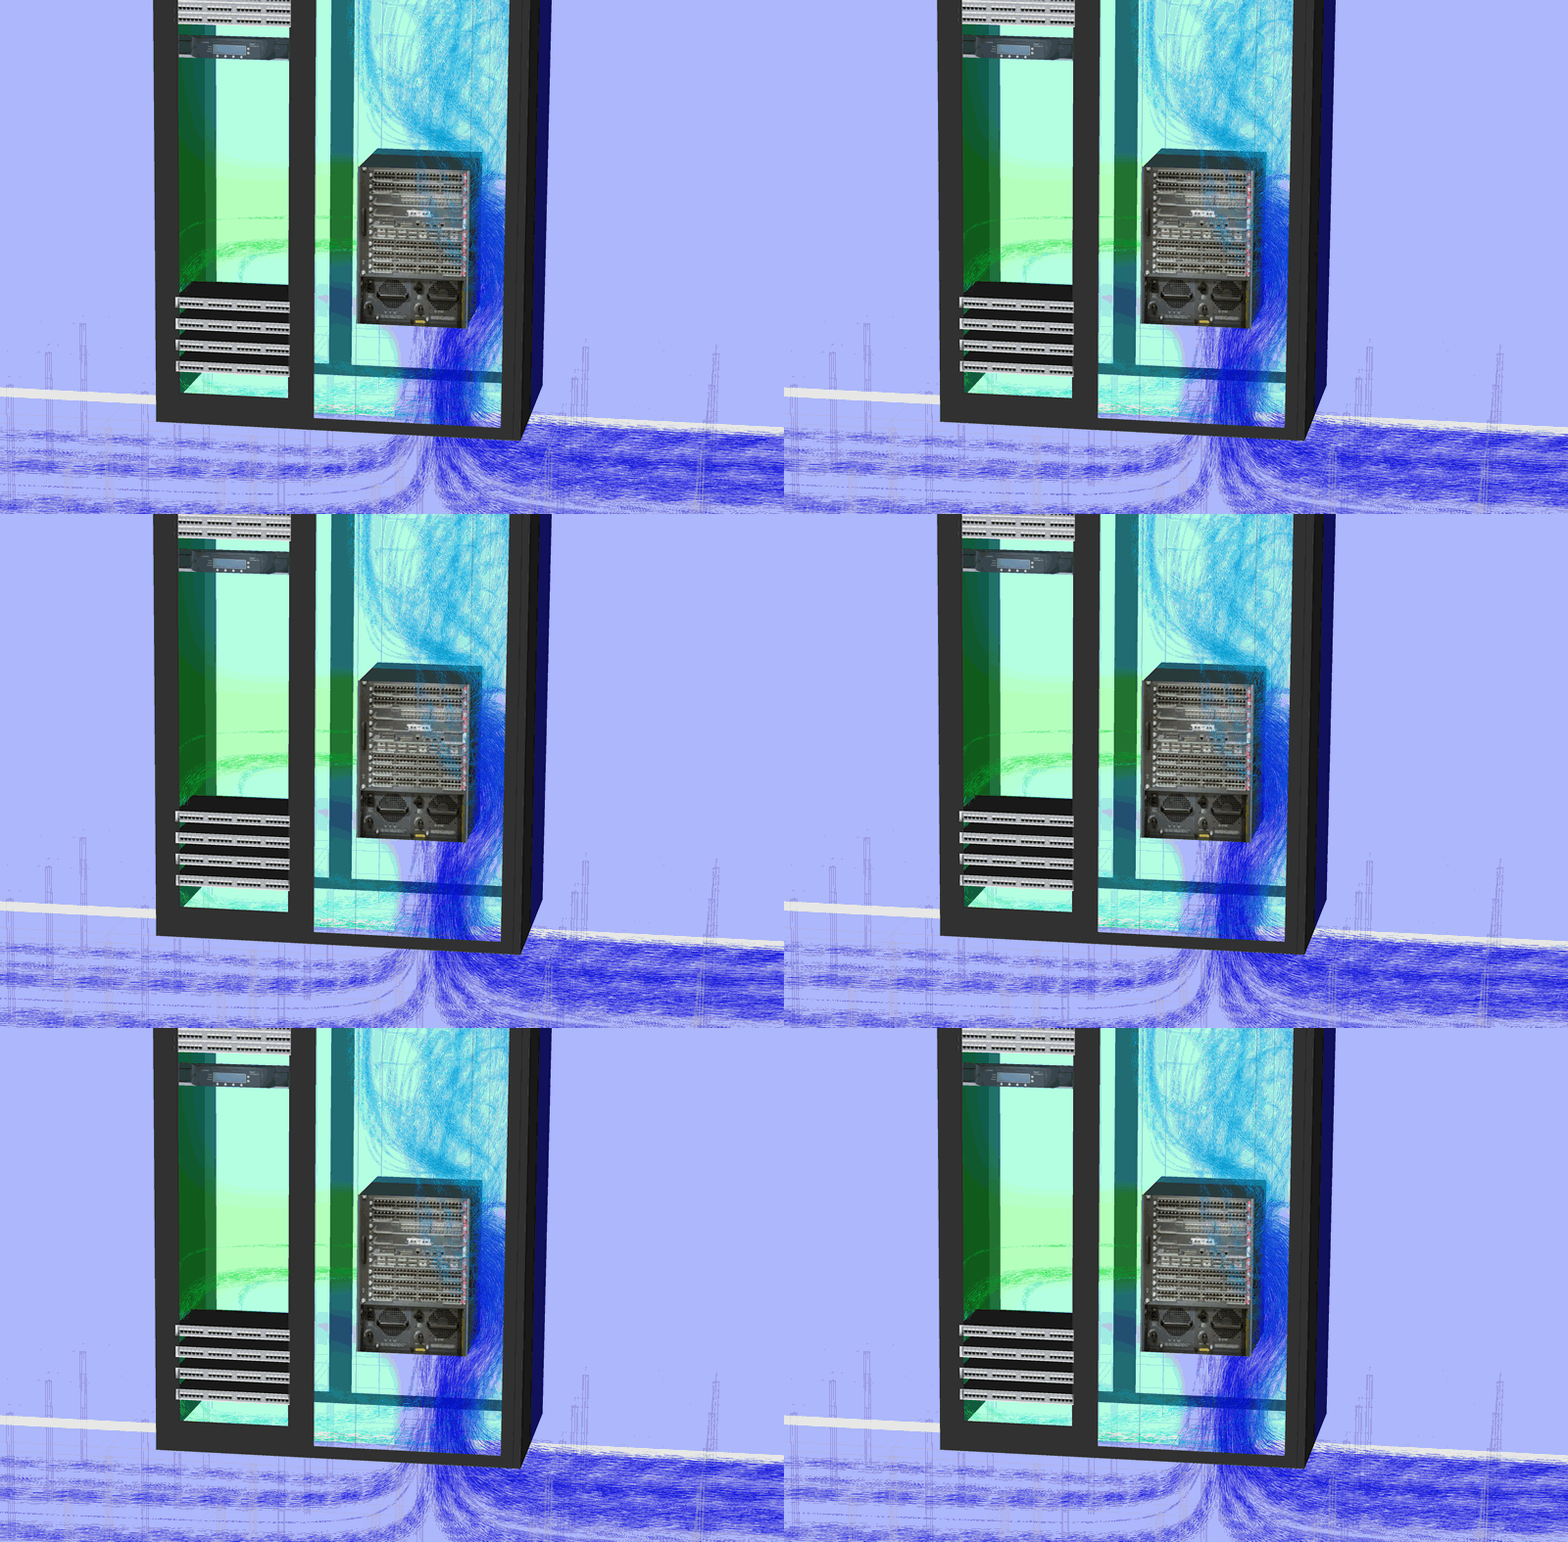
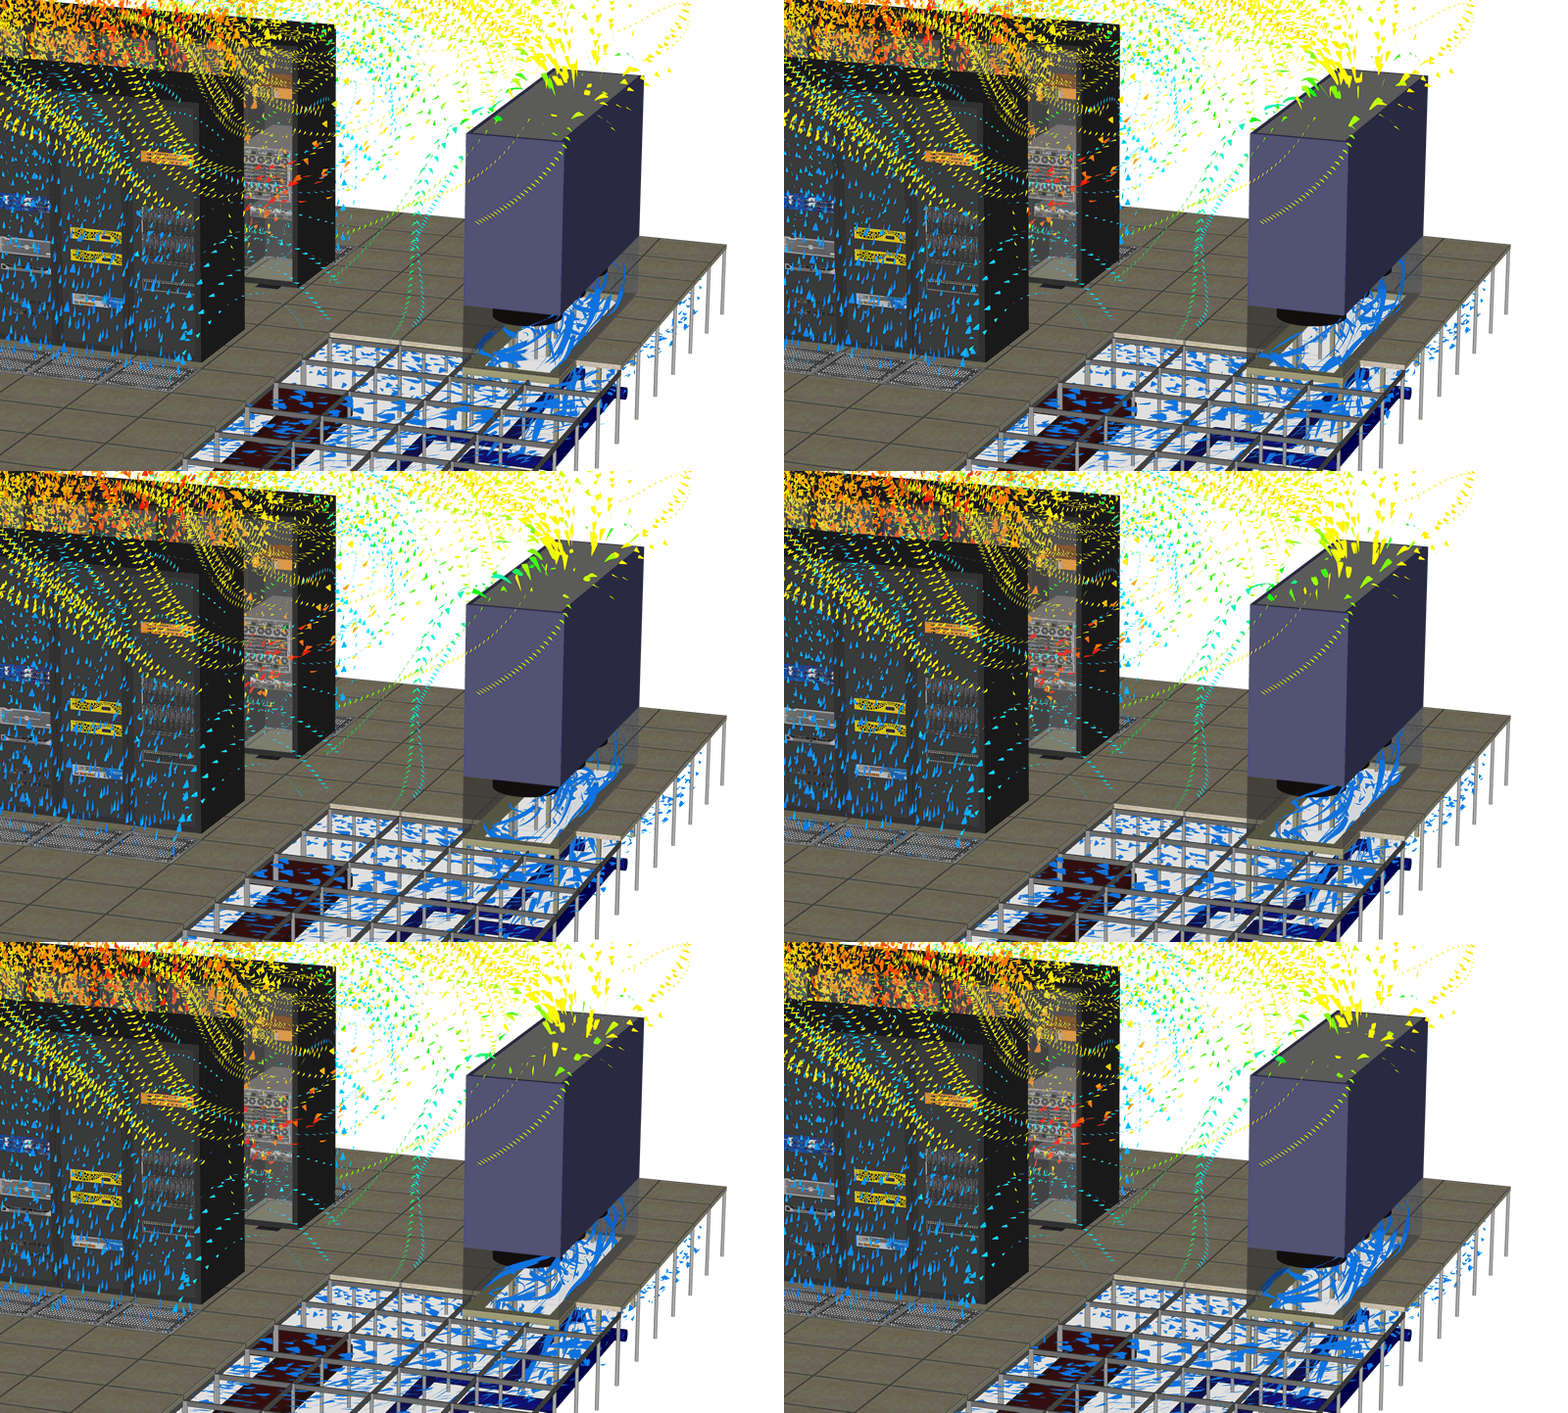
Results from the second simulation show that removing the foam from the cable penetration gives the rack a cool air supply from the pressurized floor void.
Open Cable Penetration
However, airflow distribution is complex, and simple fixes like this one will not always save the day – there may not have been enough air had the cabinet been sitting above a region of low pressure. The DC manager must also check this operational change is not denying IT further down the aisle its air supply.
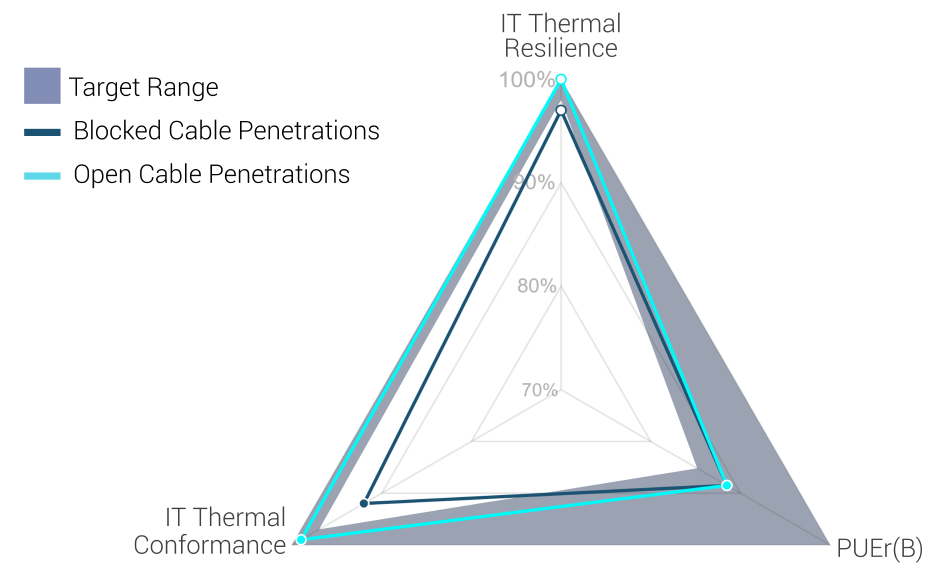
Using the Green Grid’s calculations, and the PI tool, the DC team can generate a plot that works as an executive summary to justify the changes: after the fix, the facility operates within the target range, with IT Thermal Conformance at 99% and IT Thermal Resilience at 100%.
While the fix has had no impact on PUE, equipment is now operating at temperatures closer to the supply temperature. This means that data center management can move on from diagnosis and remedy, and start looking at fine-tuning the facility’s performance.
Chapter Four: Turbocharge Performance
Venturing into improving energy efficiency, the DC manager considers upgrading the cooling unit fans to accommodate variable speed - controlling the pressure in the floor void.
As part of the cost analysis, she compares the expected performance improvements with those of raising the chilled water temperature (and consequentially the supply temperature).
Fans at 70% Flow Rate - Supply Temp 20 °C
Simulation shows how fan flow rate and supply temperature affect the whole room. And the PI score helps to quantify these effects in relation to the business's performance targets.
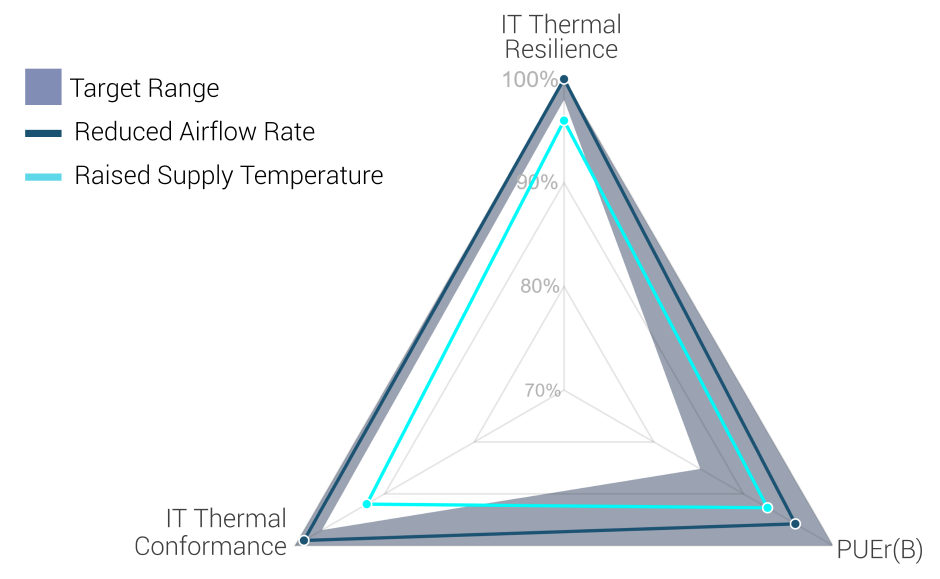
The DC manager uses the Performance Indicator to display the results side by side. In this case, controlling fan airflow rate would benefit all PI metrics, whereas a supply temperature increase would be detrimental to IT Thermal Conformance and Resilience – with predicted operation outside of the target range.
Opting for the reduction in fan flow rate is clearly the better operational decision at this point. A further benefit is the facility is responsive and flexible to load variations: as application and server load ramps up or down, so too can the air delivered to the IT. However, whether this facility can house its full capacity is a separate scenario to be considered.
Chapter Five: Fill'er Up
Whether their capacity/deployment plans are known or not, the team can simulate the facility’s performance when all racks are fully loaded.
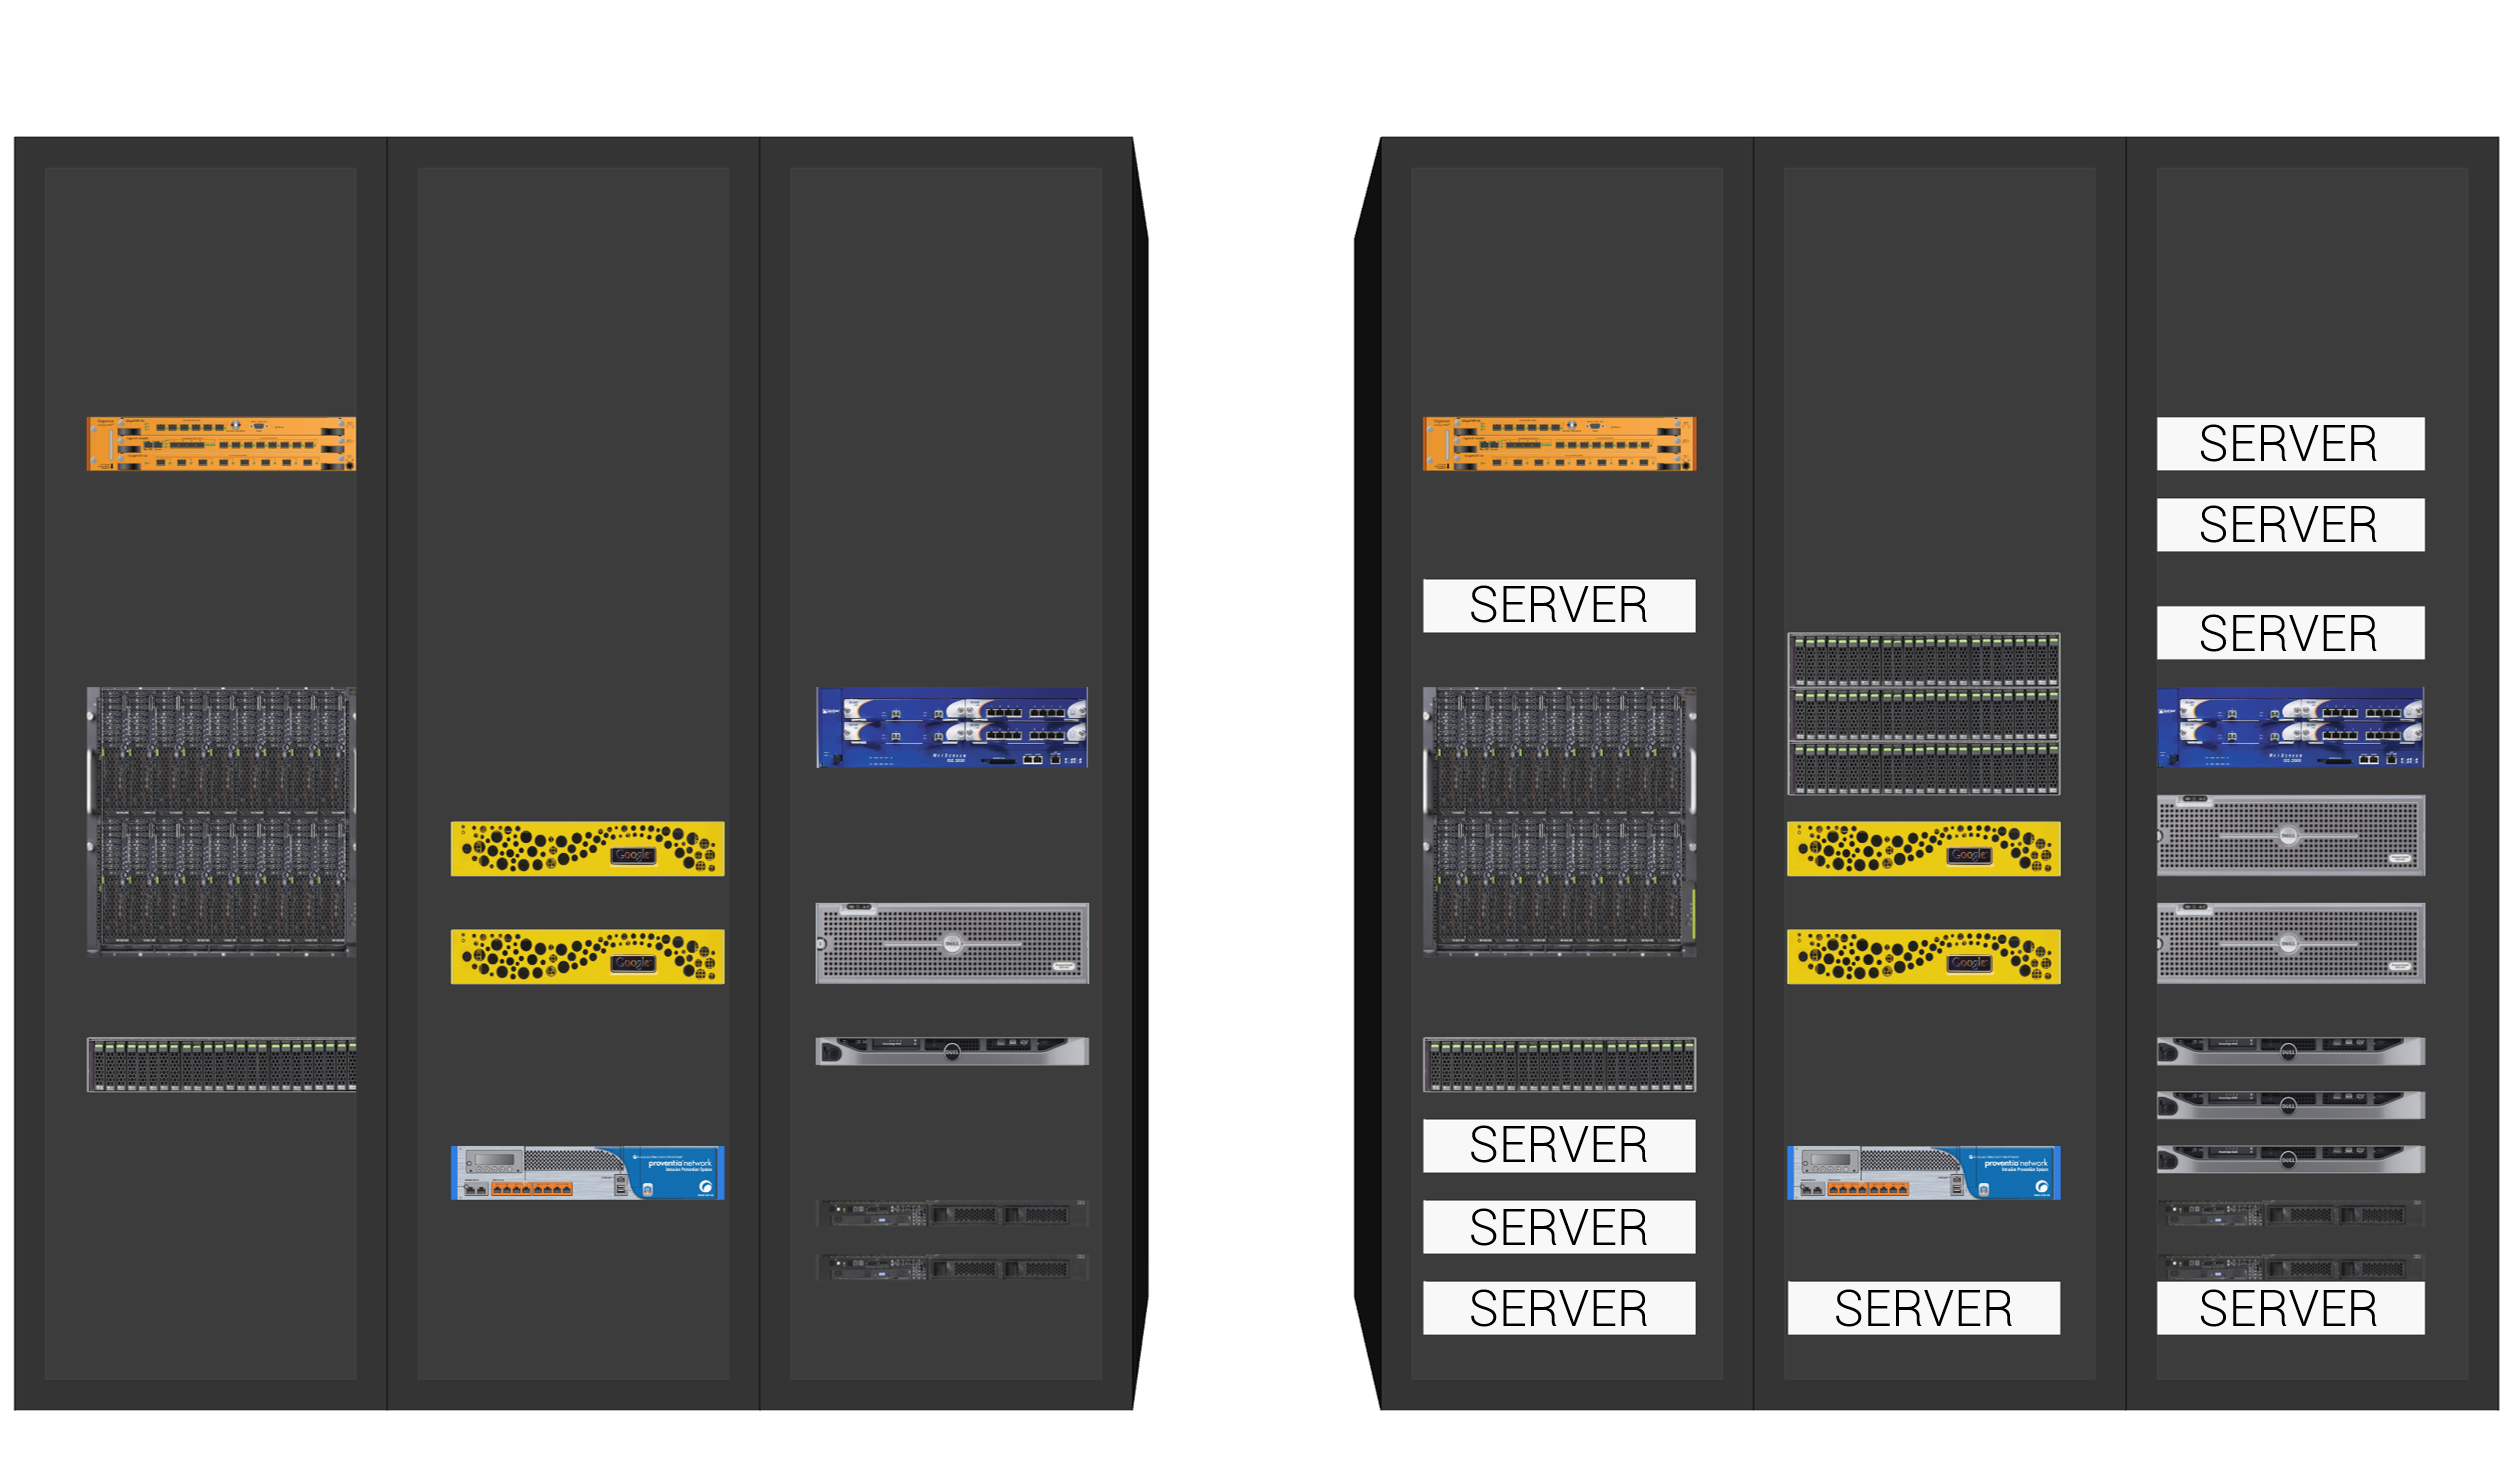
They use library models of any manufacturer’s equipment for known future deployment plans, and add generic conceptual servers of a specific power to simulate a full design capacity.
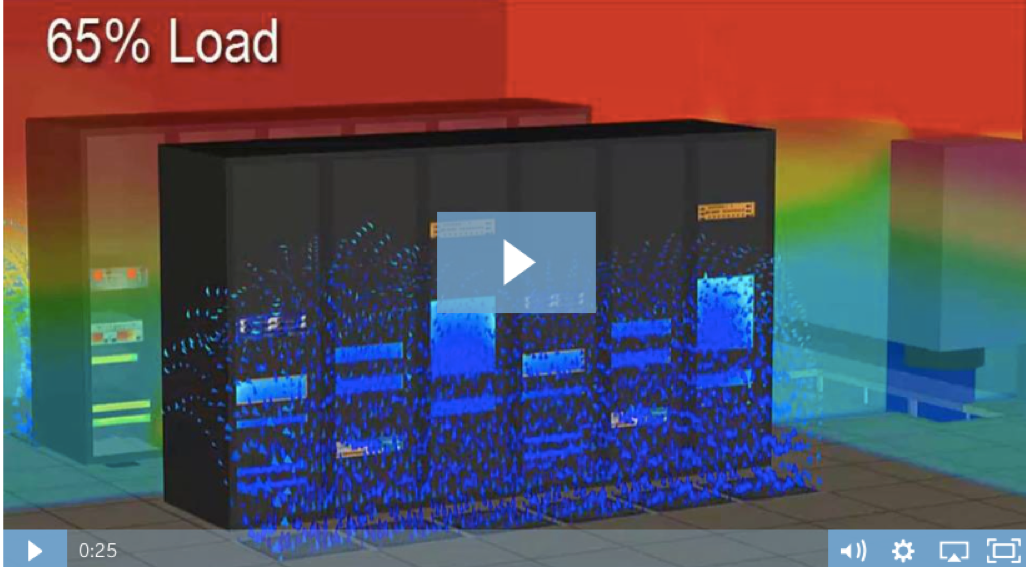
In this example, the partially-loaded racks in the model (left) are filled with additional vendor-specific equipment models and generic conceptual servers (shown in white), to reach the racks’ design capacities (right).
The simulation in this video shows the impact of new installations. Not only does new IT receive hot recirculated air, but existing equipment also begins to suffer.
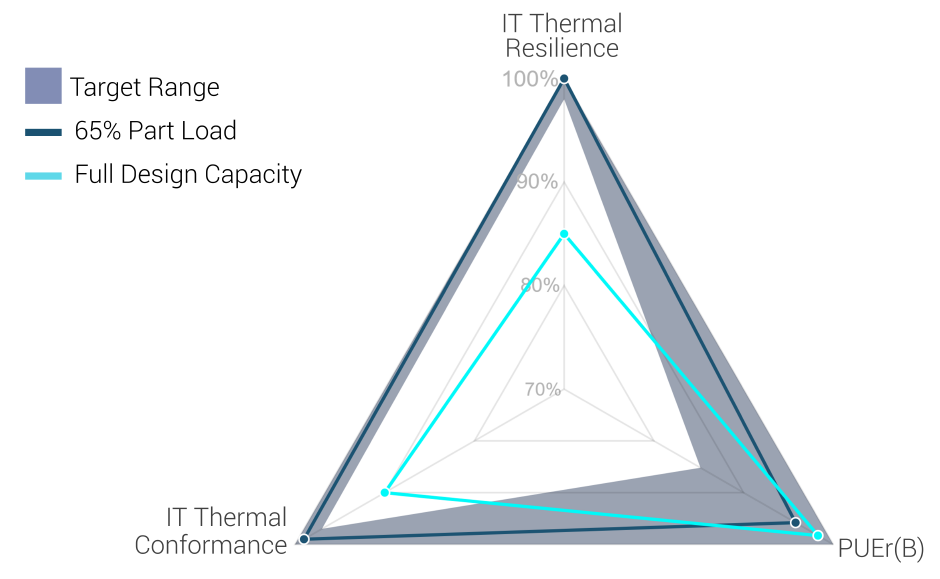
The results are then used to generate PI scores for the partially- and fully-loaded racks. These show the facility cannot be safely loaded to full capacity while remaining within the target range for IT Thermal Conformance and Resillience.
The next step for the DC manager is to use the simulation results to figure out why the operational facility cannot safely reach the design, and what they can do to change that.
Whether you want to diagnose shortcomings in operation, assess the impact of thermal fixes or predict future performance for operational planning, PI can help you quantify and visualize your facility’s performance for each scenario.
In this discussion, we saw that removing the foam seal from the cable penetrations of glass-doored racks fixed the IT overheat issues. With a reduced flow rate, energy efficiency was improved without compromising the cooling of equipment. But with the current facility configuration, our DC manager cannot install to the full design capacity without risking 15% of her equipment load.
Maybe not the happy ending we were hoping for, but at least we knew before we got there.
For instructions and a detailed example on how to collect the data, generate CFD simulations and calculate the metrics, see the Performance Indicator whitepaper by The Green Grid.
The content from this blog originally appeared in the Future Facilities Blog on July 19, 2017.


